Reading retention in the way people listen

Three years of data from a major music-streaming platform showed flat growth. Underneath were platforms losing the listeners they had just won, a yearly cycle of interest and drop-off, and two very different ways of listening. Measuring stickiness, how often listeners chose to come back, alongside listening time brought them into view.

Role
Solo, end to end
Context
Analytics case study · 2023
Data
6 platforms · 2018–2020
Tools
R · ggplot2
Key Strengths

What this case study shows about how I work

This was a product analytics case study using aggregate platform data. The company's name is withheld. All figures are my originals, built in R.

At a glance

A flat total with four stories underneath

Headline listener counts barely moved in three years. Splitting them by platform and time, and measuring how people listened, showed where the product was working and where it wasn't.

+3.3%

Net listener growth in three years (64.3M → 66.4M monthly listeners). That small number covers a yearly pattern of new listeners arriving and then drifting away.

iOS ≈ Android

Both gained new listeners at nearly the same rate, but only iOS kept them. How fast a platform acquired listeners didn't predict whether it retained them.

Web

It gained new listeners faster than any other platform and lost them faster too. That could make it an on-ramp to other platforms, or it could mean the Web experience is losing people.

2× the days

Mobile listeners came back about twice as often as others, but had the shortest sessions (84 min on iOS vs. 174 on Web). The platforms serve two different kinds of listening.

The brief

A retention question with only three variables

The platform wanted to know how well it was keeping listeners over three years, on every device they used. The data was thin: aggregate counts only, with no user-level records, surveys or demographics.

Monthly unique listeners Daily unique listeners Daily seconds listened
iOS Android Web Roku Amazon All Others

The ask

Assess listener retention from January 2018 to December 2020 across six platform groups, and recommend where product should focus.

Research questions

  1. Is the listener base growing, and is that growth lasting?
  2. Why does retention differ across platforms?
  3. Can three aggregate counts give a better signal of listener satisfaction than a headcount?
Approach

Split the data, test the obvious explanation, then find a better measure

Break it down

I split the total by platform and by month, then marked each year and zoomed in until patterns in the aggregate became visible.

Test a rival explanation

Were losing platforms simply attracting fewer new listeners? Comparing monthly with cumulative listener counts separated acquisition from retention.

Choose the right metric, then test it

I used stickiness, expressed as active days per listener, as a behavioral stand-in for satisfaction, then checked its blind spot against listening time.

↓ I show data the way I'd present it to a room: one layer at a time. As you scroll, each chart below builds step by step. Click or tap any chart to see it full size.
Finding 1

The flat headline hides a yearly cycle

Monthly unique listeners by platform
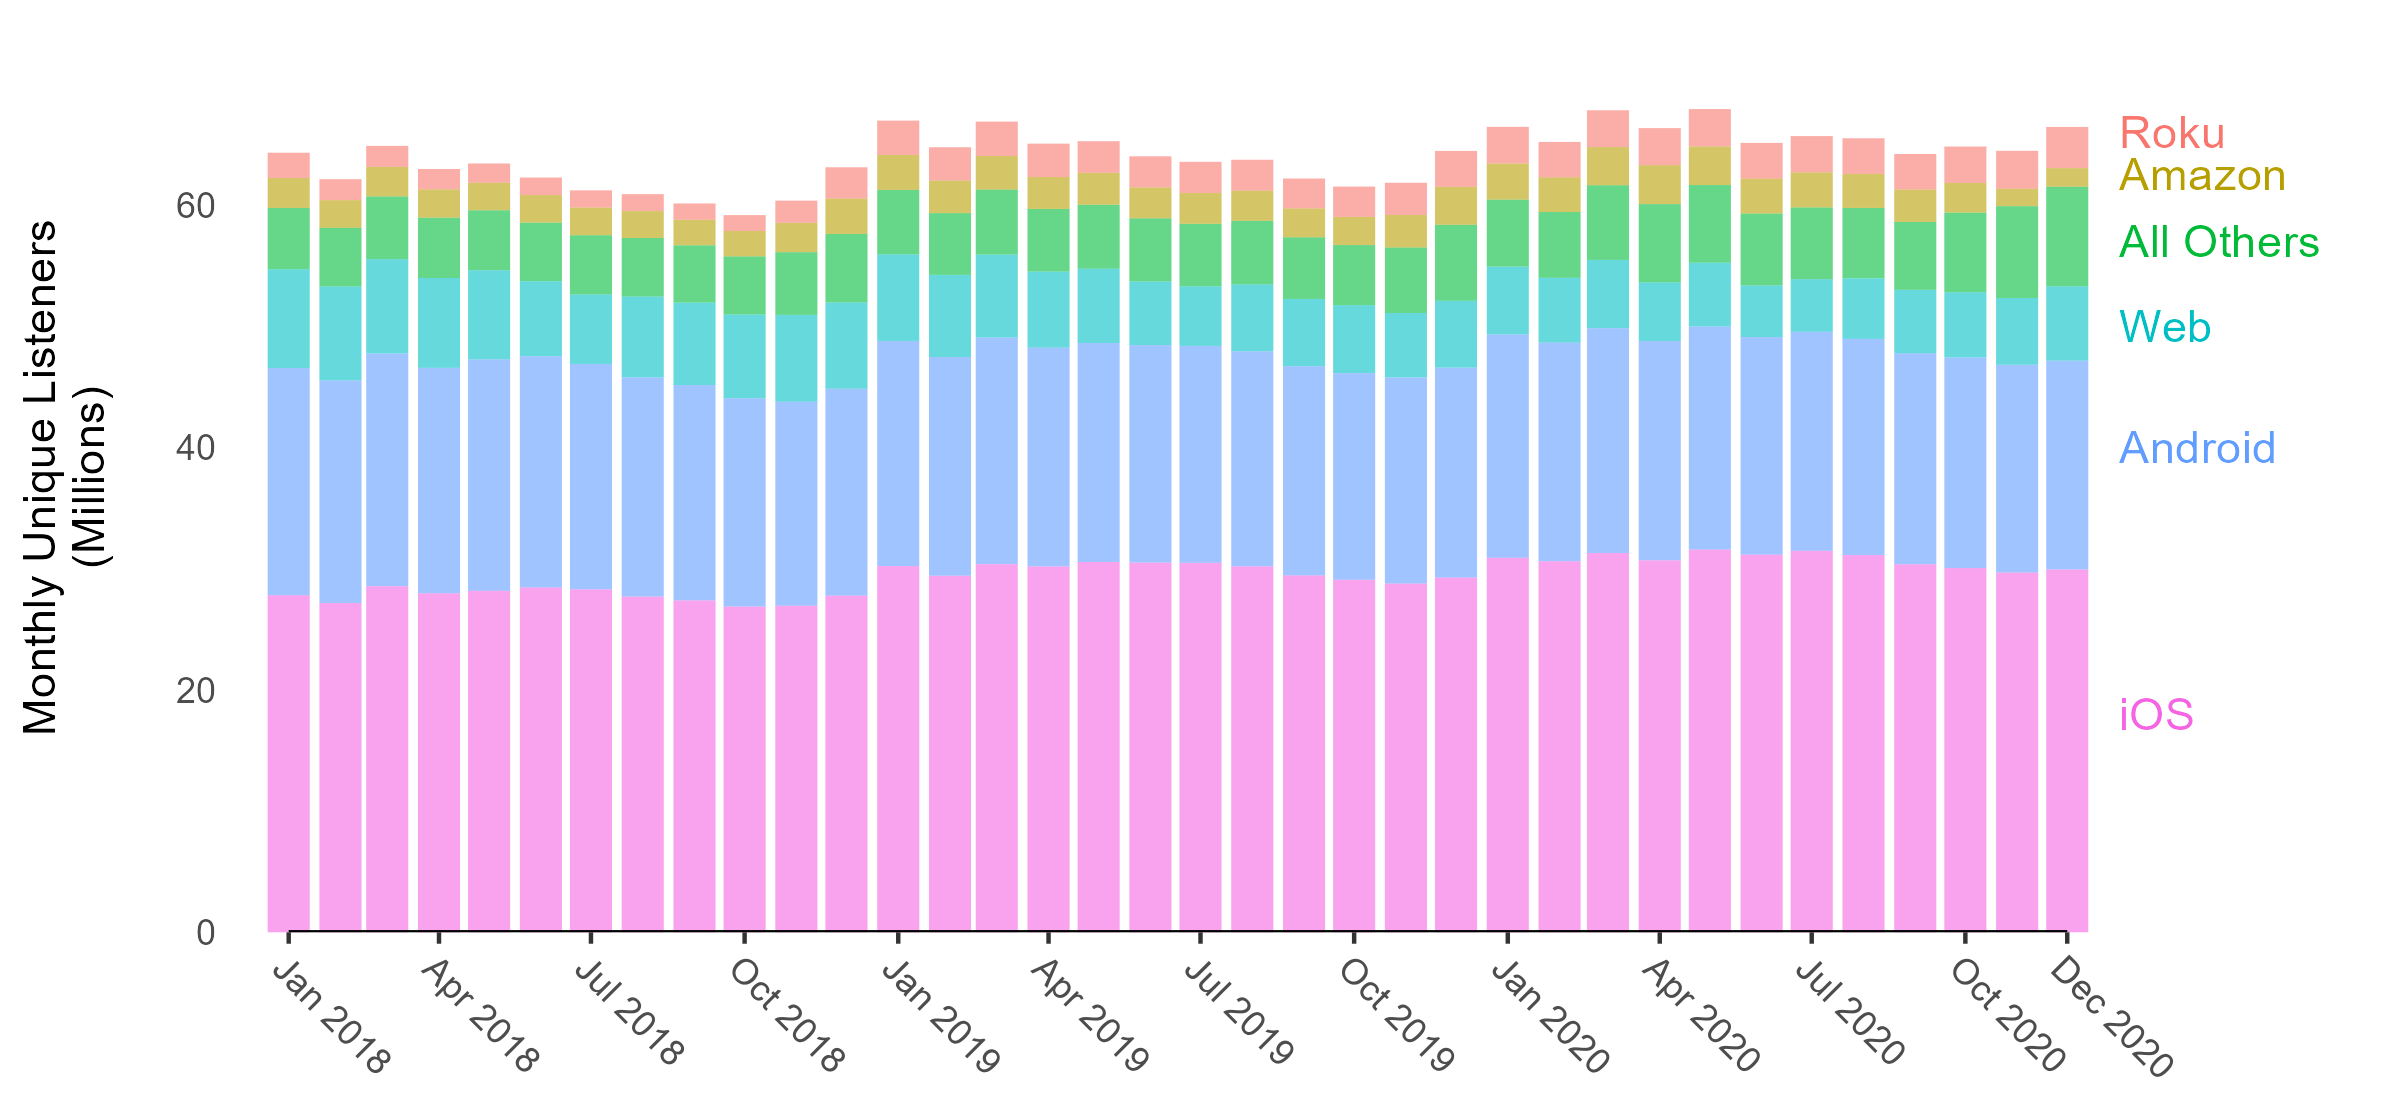
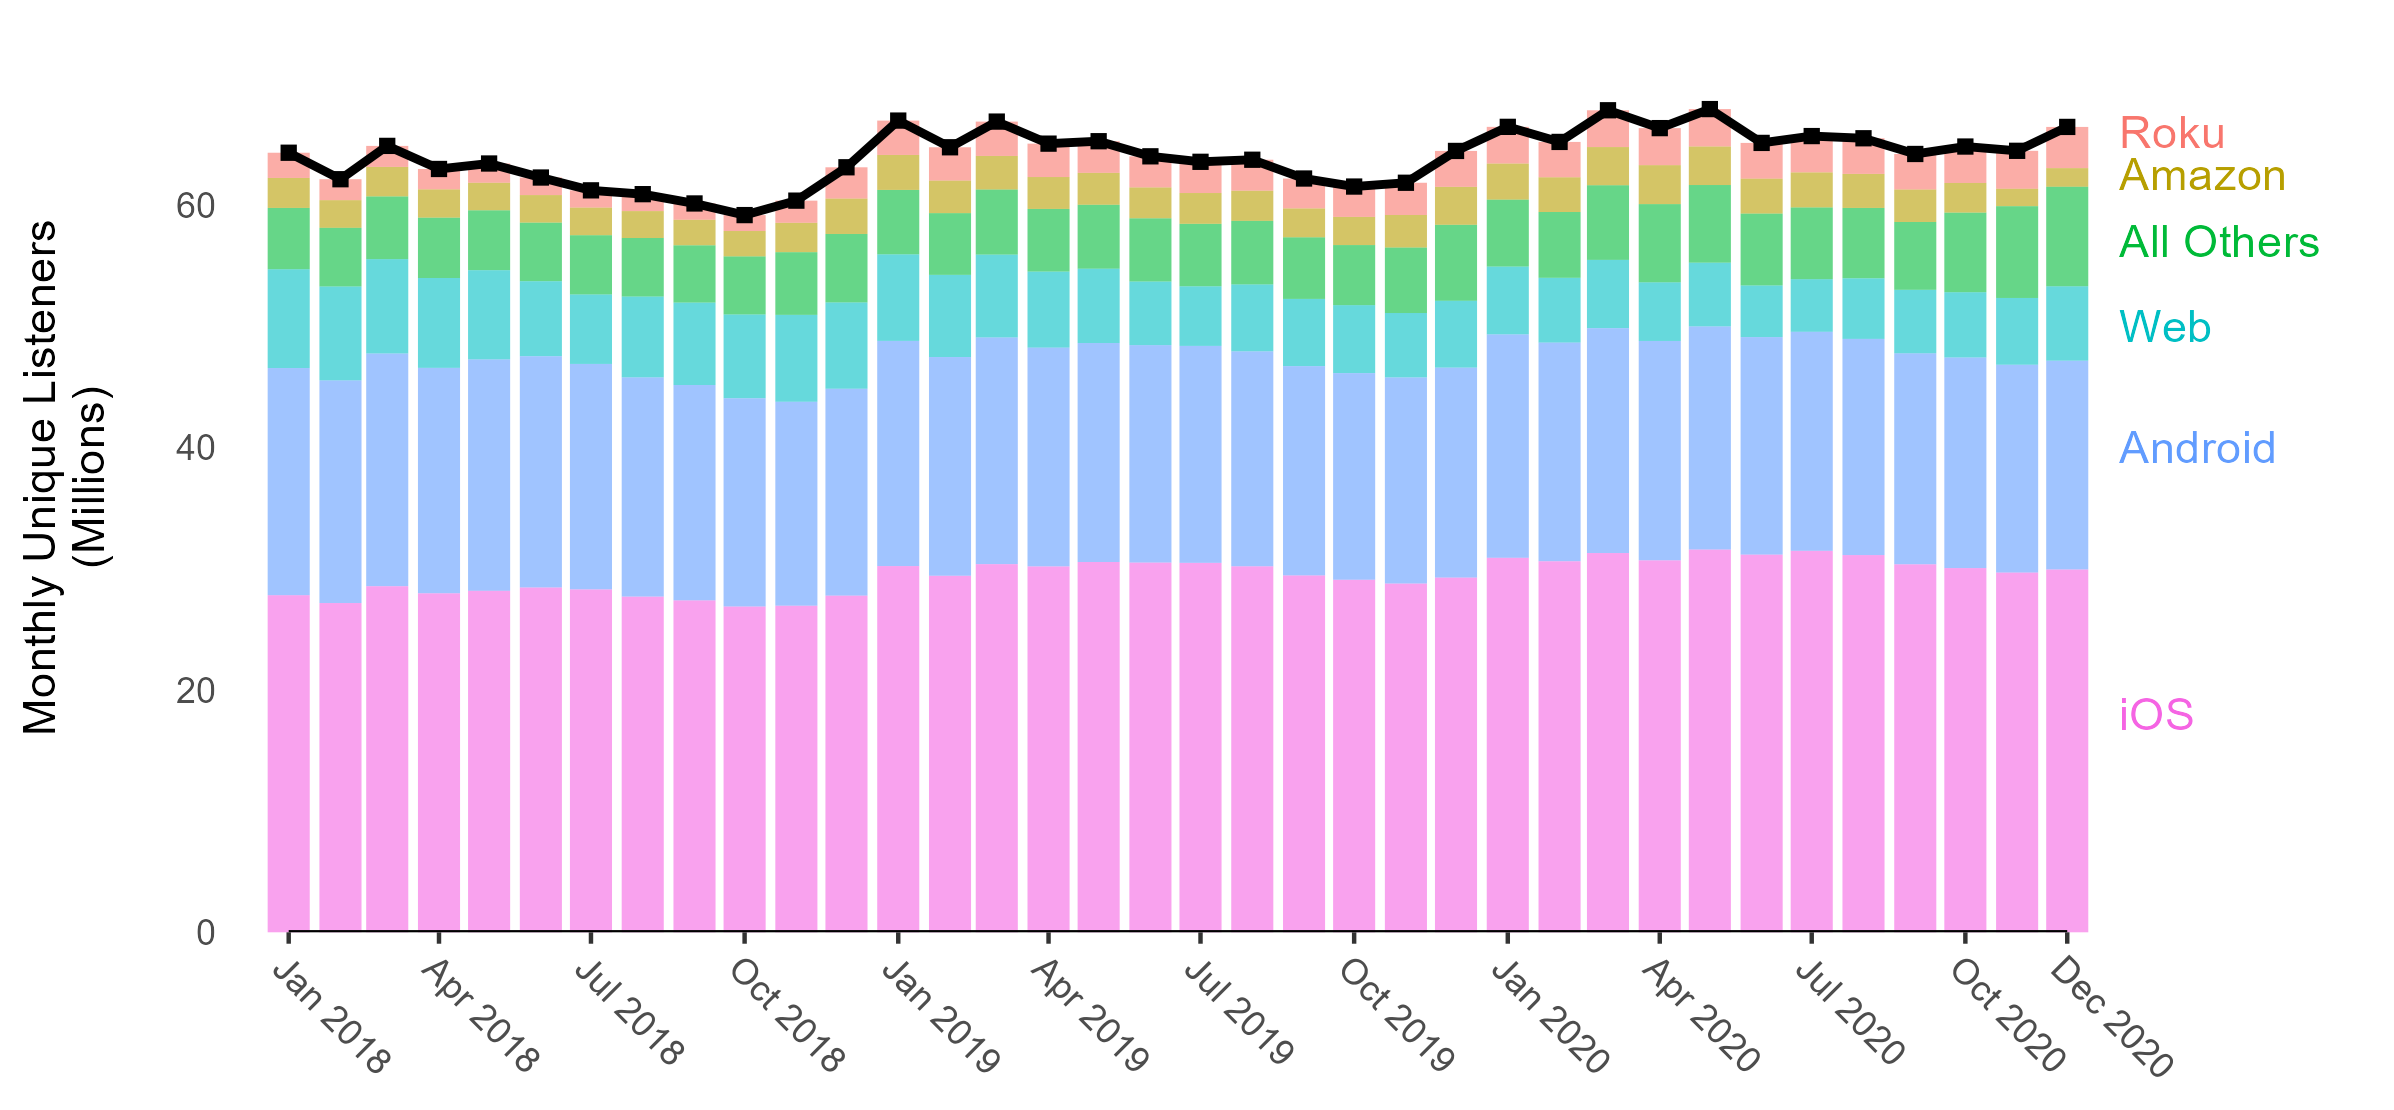
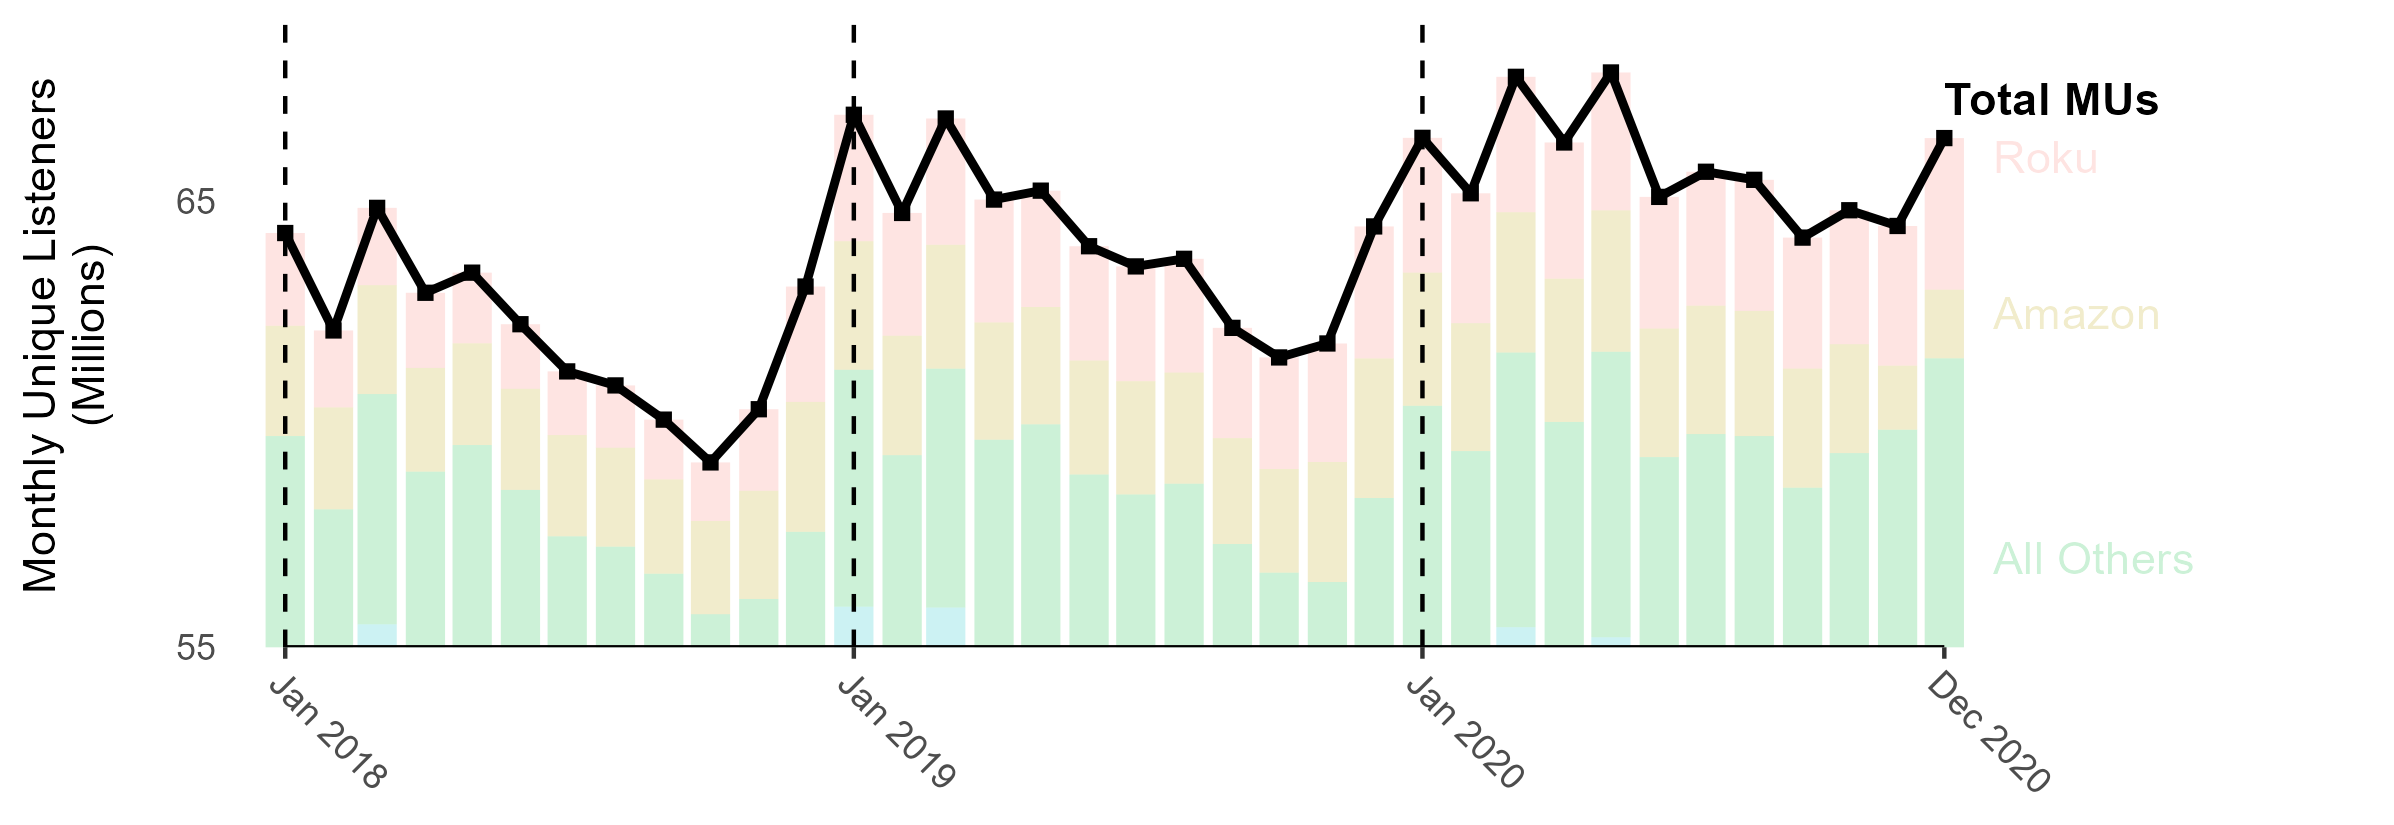
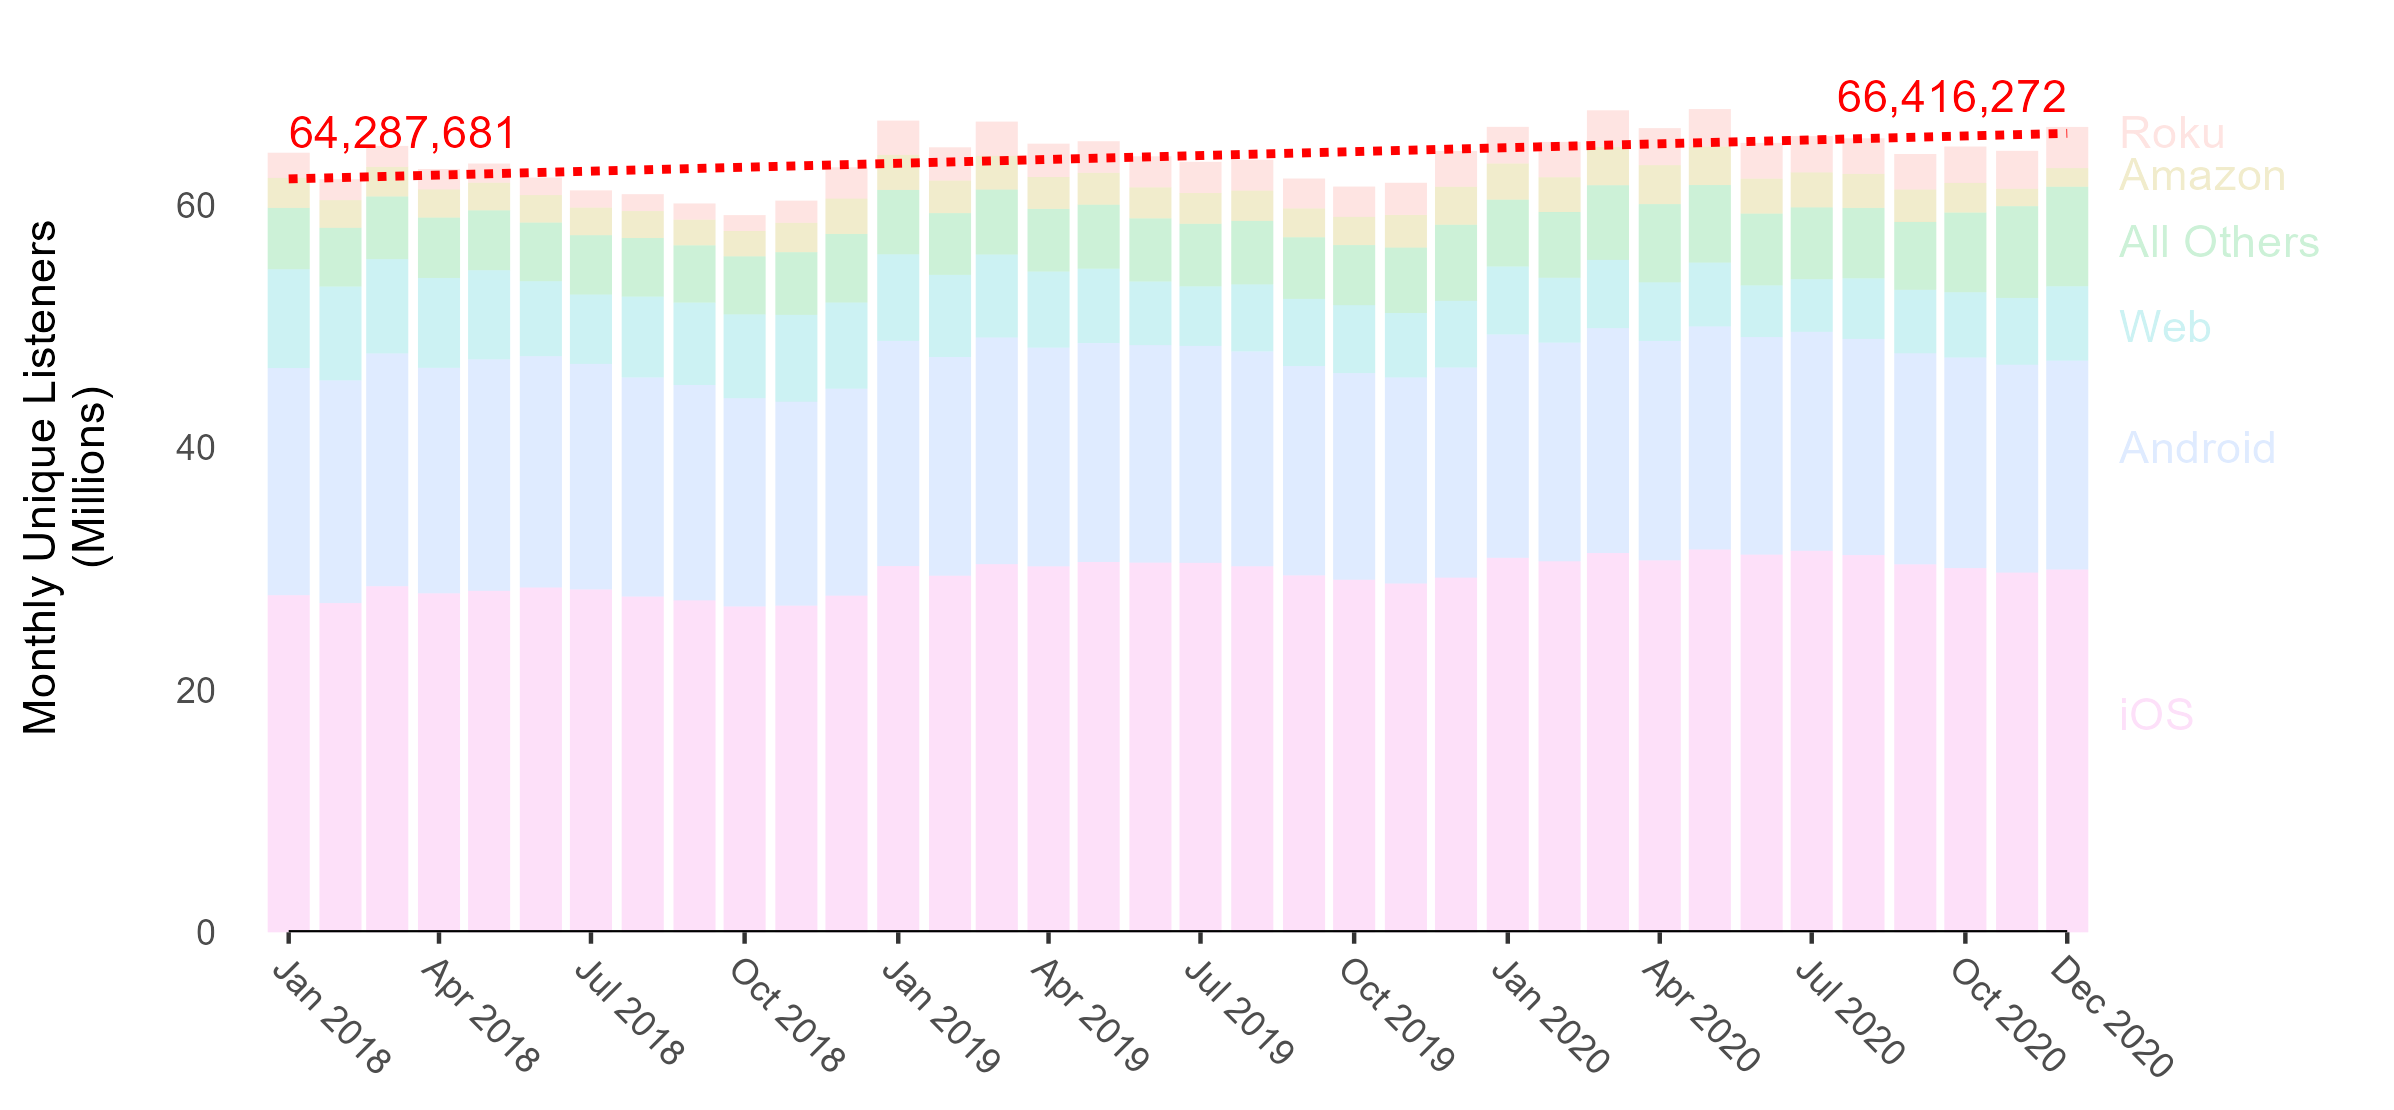
Stacked bars of monthly unique listeners by platform, Jan 2018 to Dec 2020. iOS and Android make up most of roughly 60 to 67 million monthly listeners. The same stacked bars with a black line tracing total monthly listeners, which rises and falls over each year. Bars faded, with a red dotted line from 64,287,681 listeners in Jan 2018 to 66,416,272 in Dec 2020. Zoomed view of total monthly listeners with dashed lines at each January: sharp peaks each January, a trough around October, and recovery through the holidays. ⤢ Enlarge

Listening is mostly mobile

Of the roughly 65M people who listen each month, more than 70% use iOS or Android.

The total goes up and down more than it grows

The black line is the total across all platforms, and the same rise-and-fall shape shows up every year.

Three years of growth: 3.3%

From January 2018 to December 2020, monthly listeners grew from 64,287,681 to 66,416,272, a gain of about 2 million.

+3.3% in 3 years

A new-year spike, then a slow fade

With the scale zoomed in and each January marked, the cycle is clear. Listeners jump at the start of the year, fall to a low around October, and come back over the holidays.

New listeners keep arriving, but many don't stay. The dip appeared to ease in later years, which is worth tracing back to whatever changed.

Finding 2

Acquiring listeners doesn't mean keeping them

Monthly vs. cumulative unique listeners (millions)
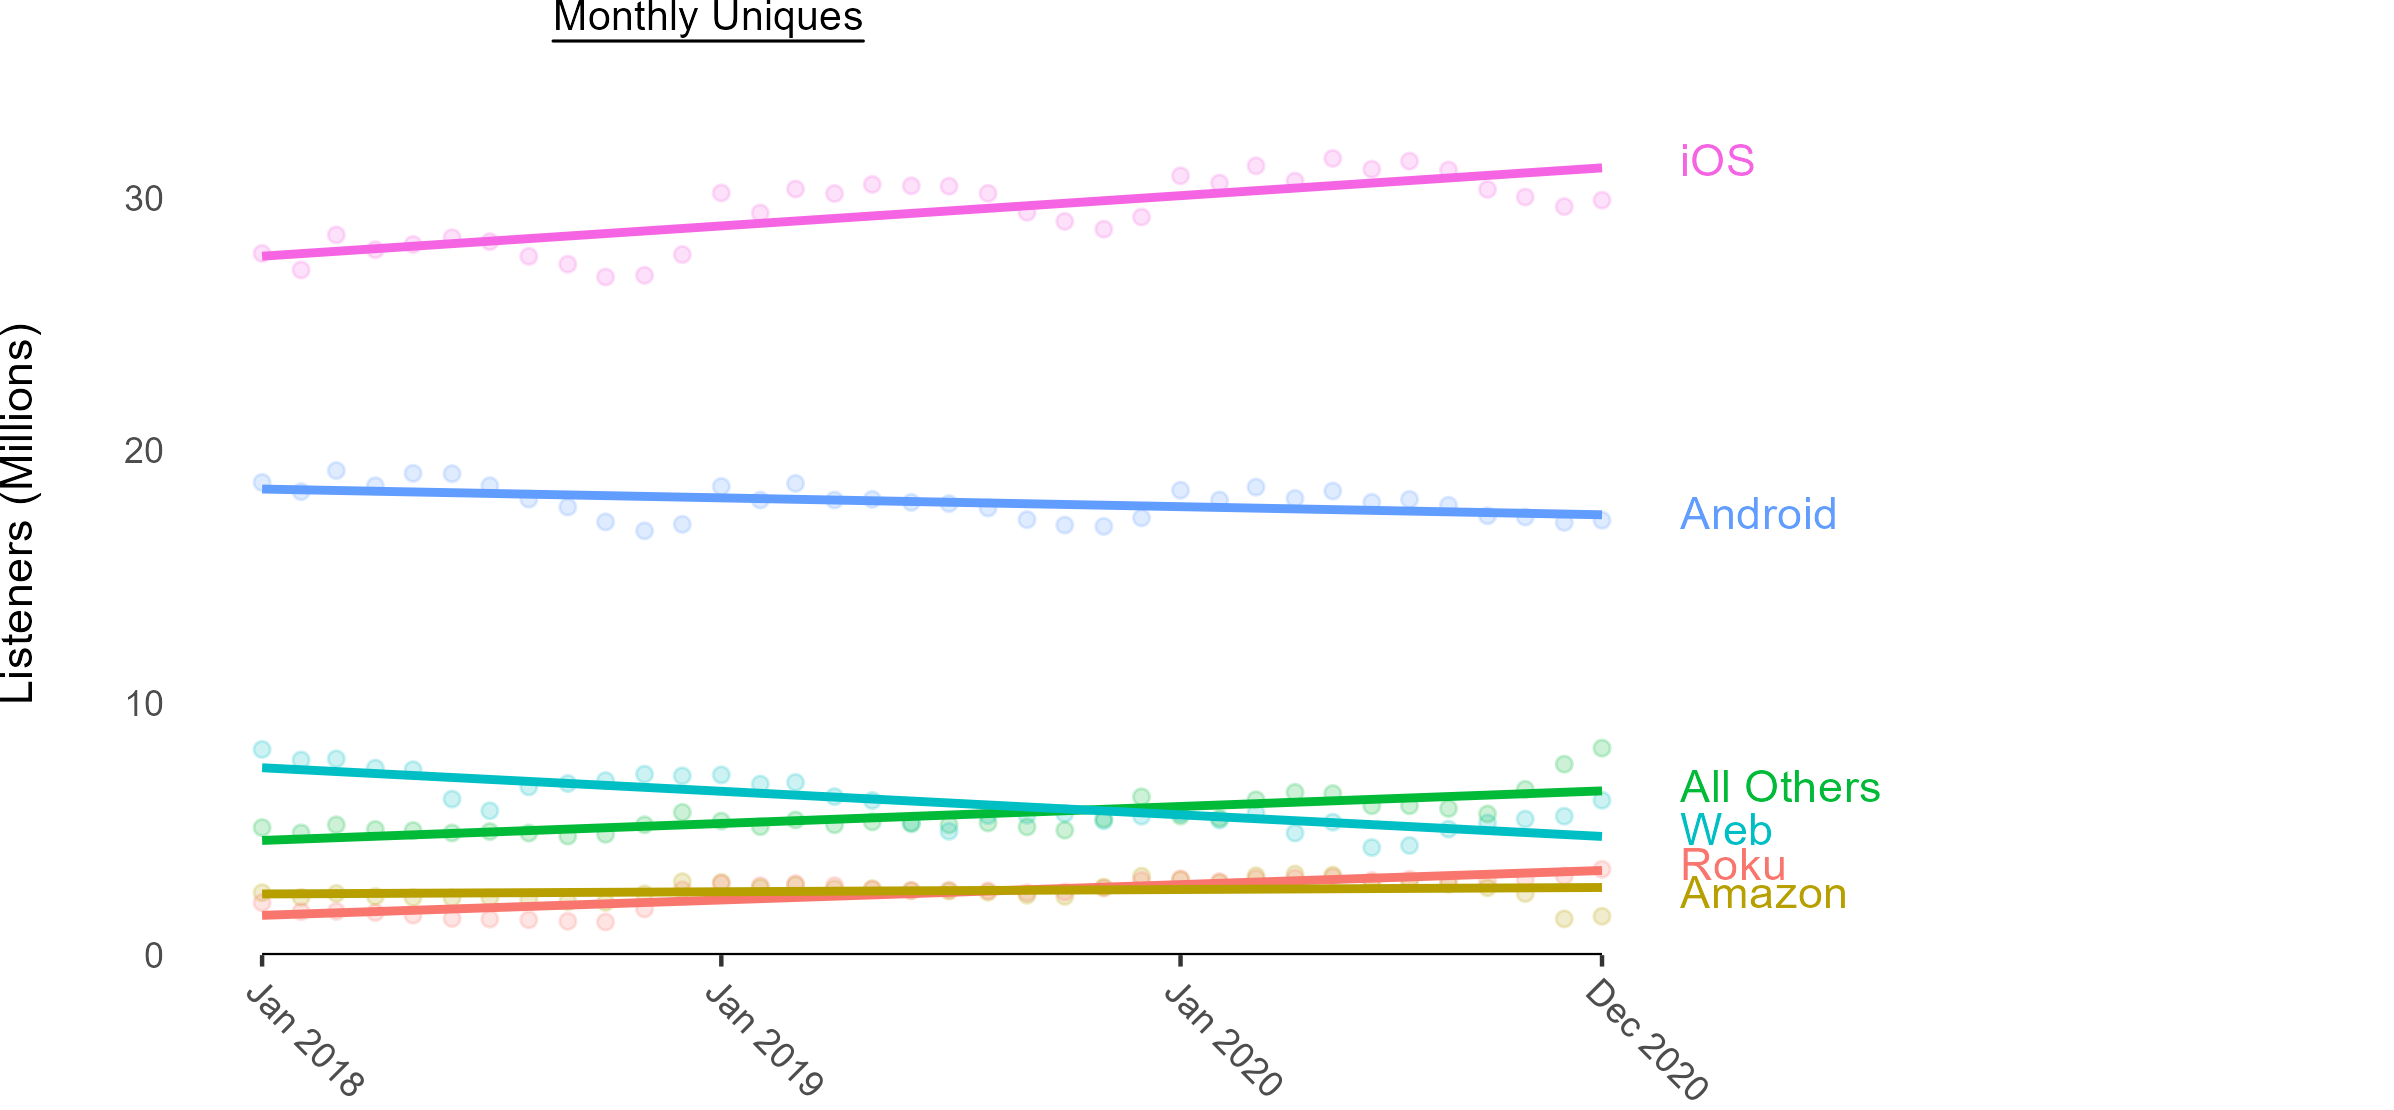
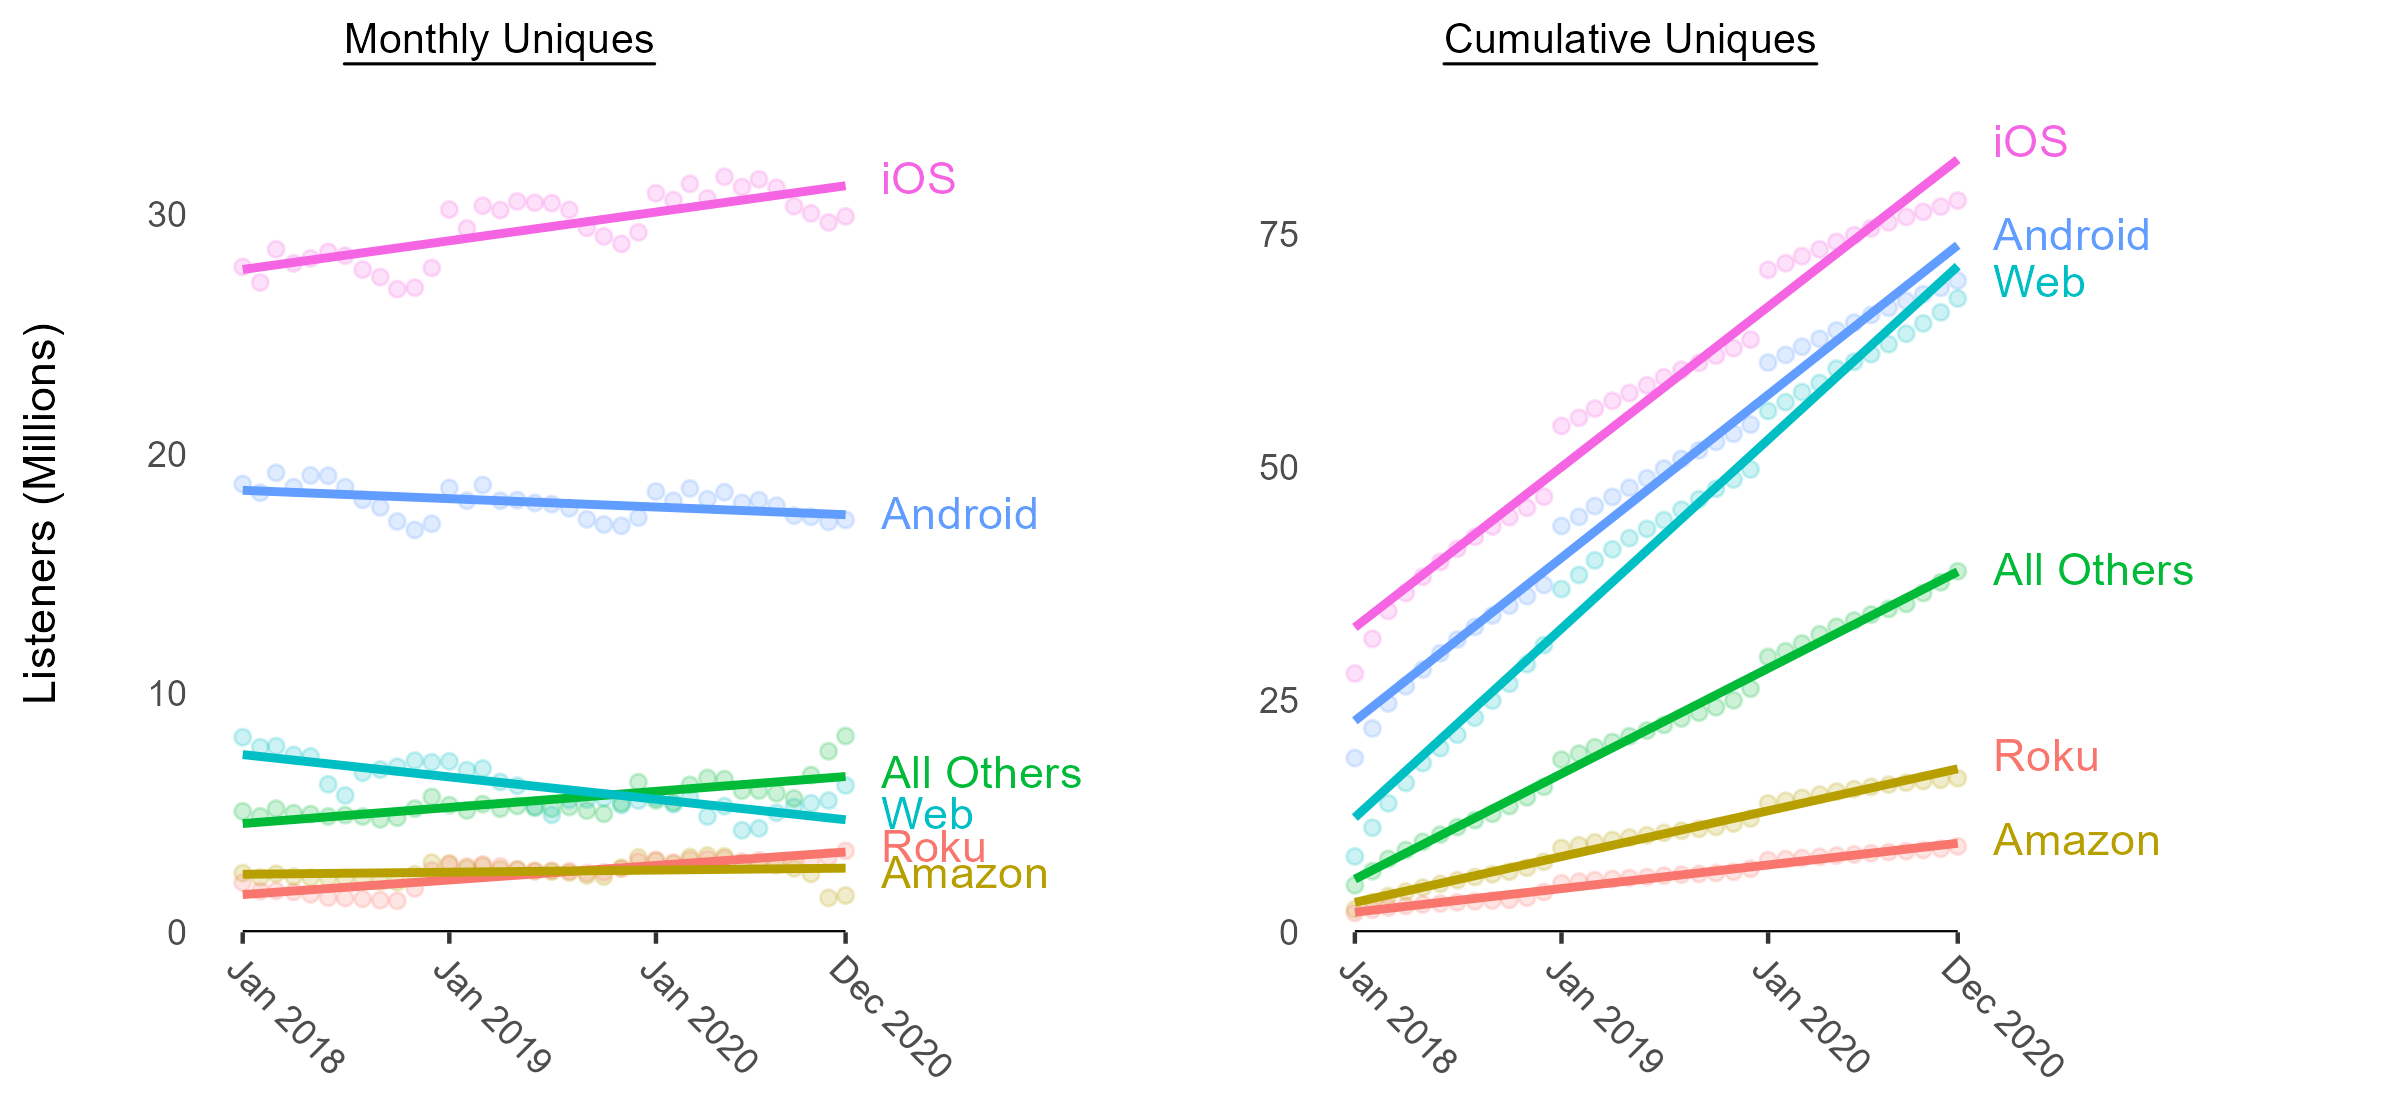
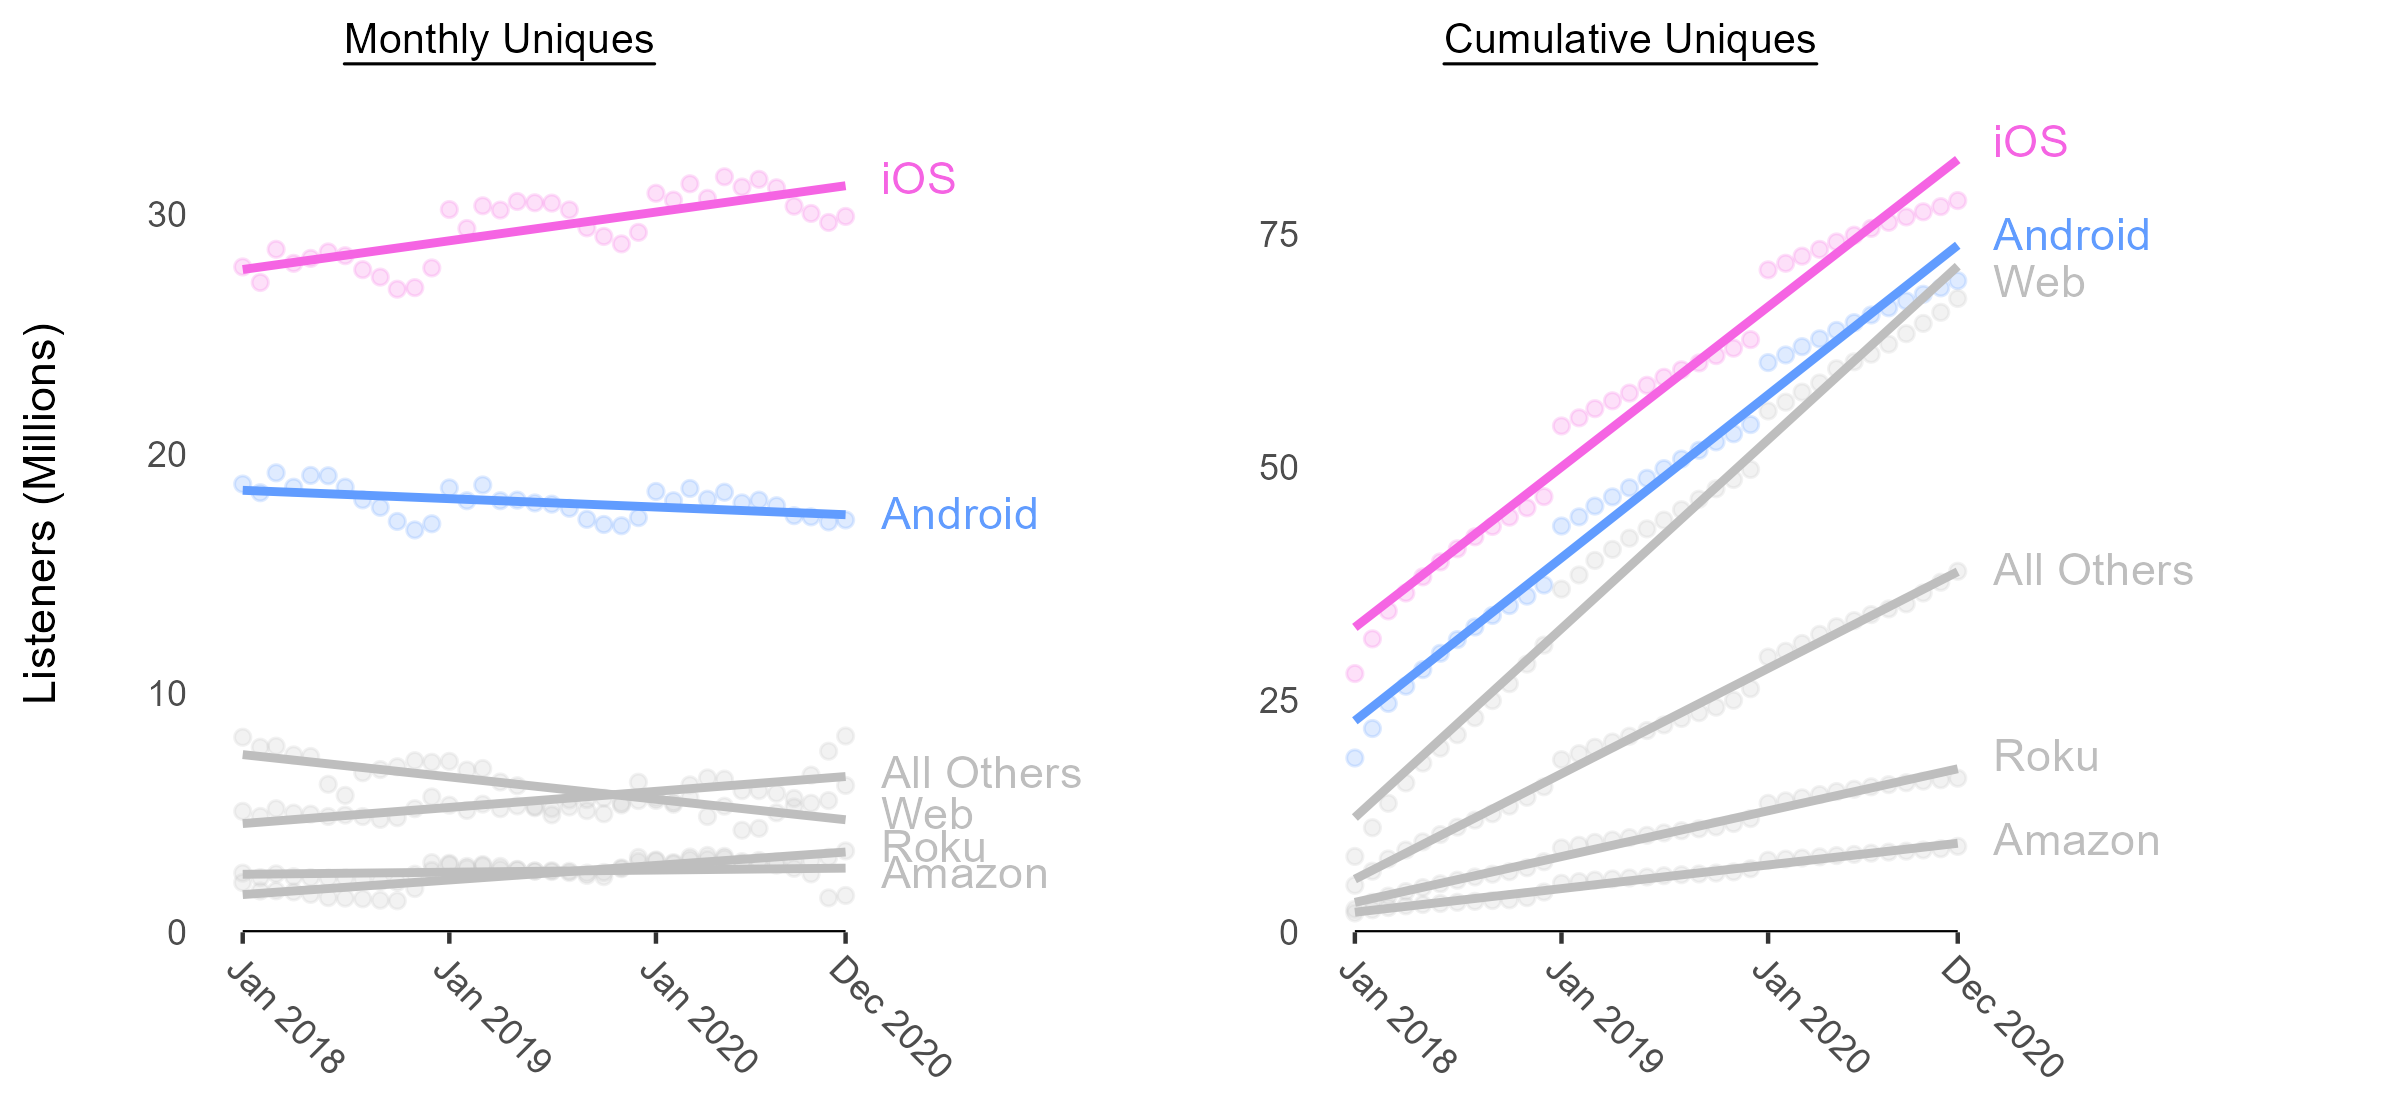
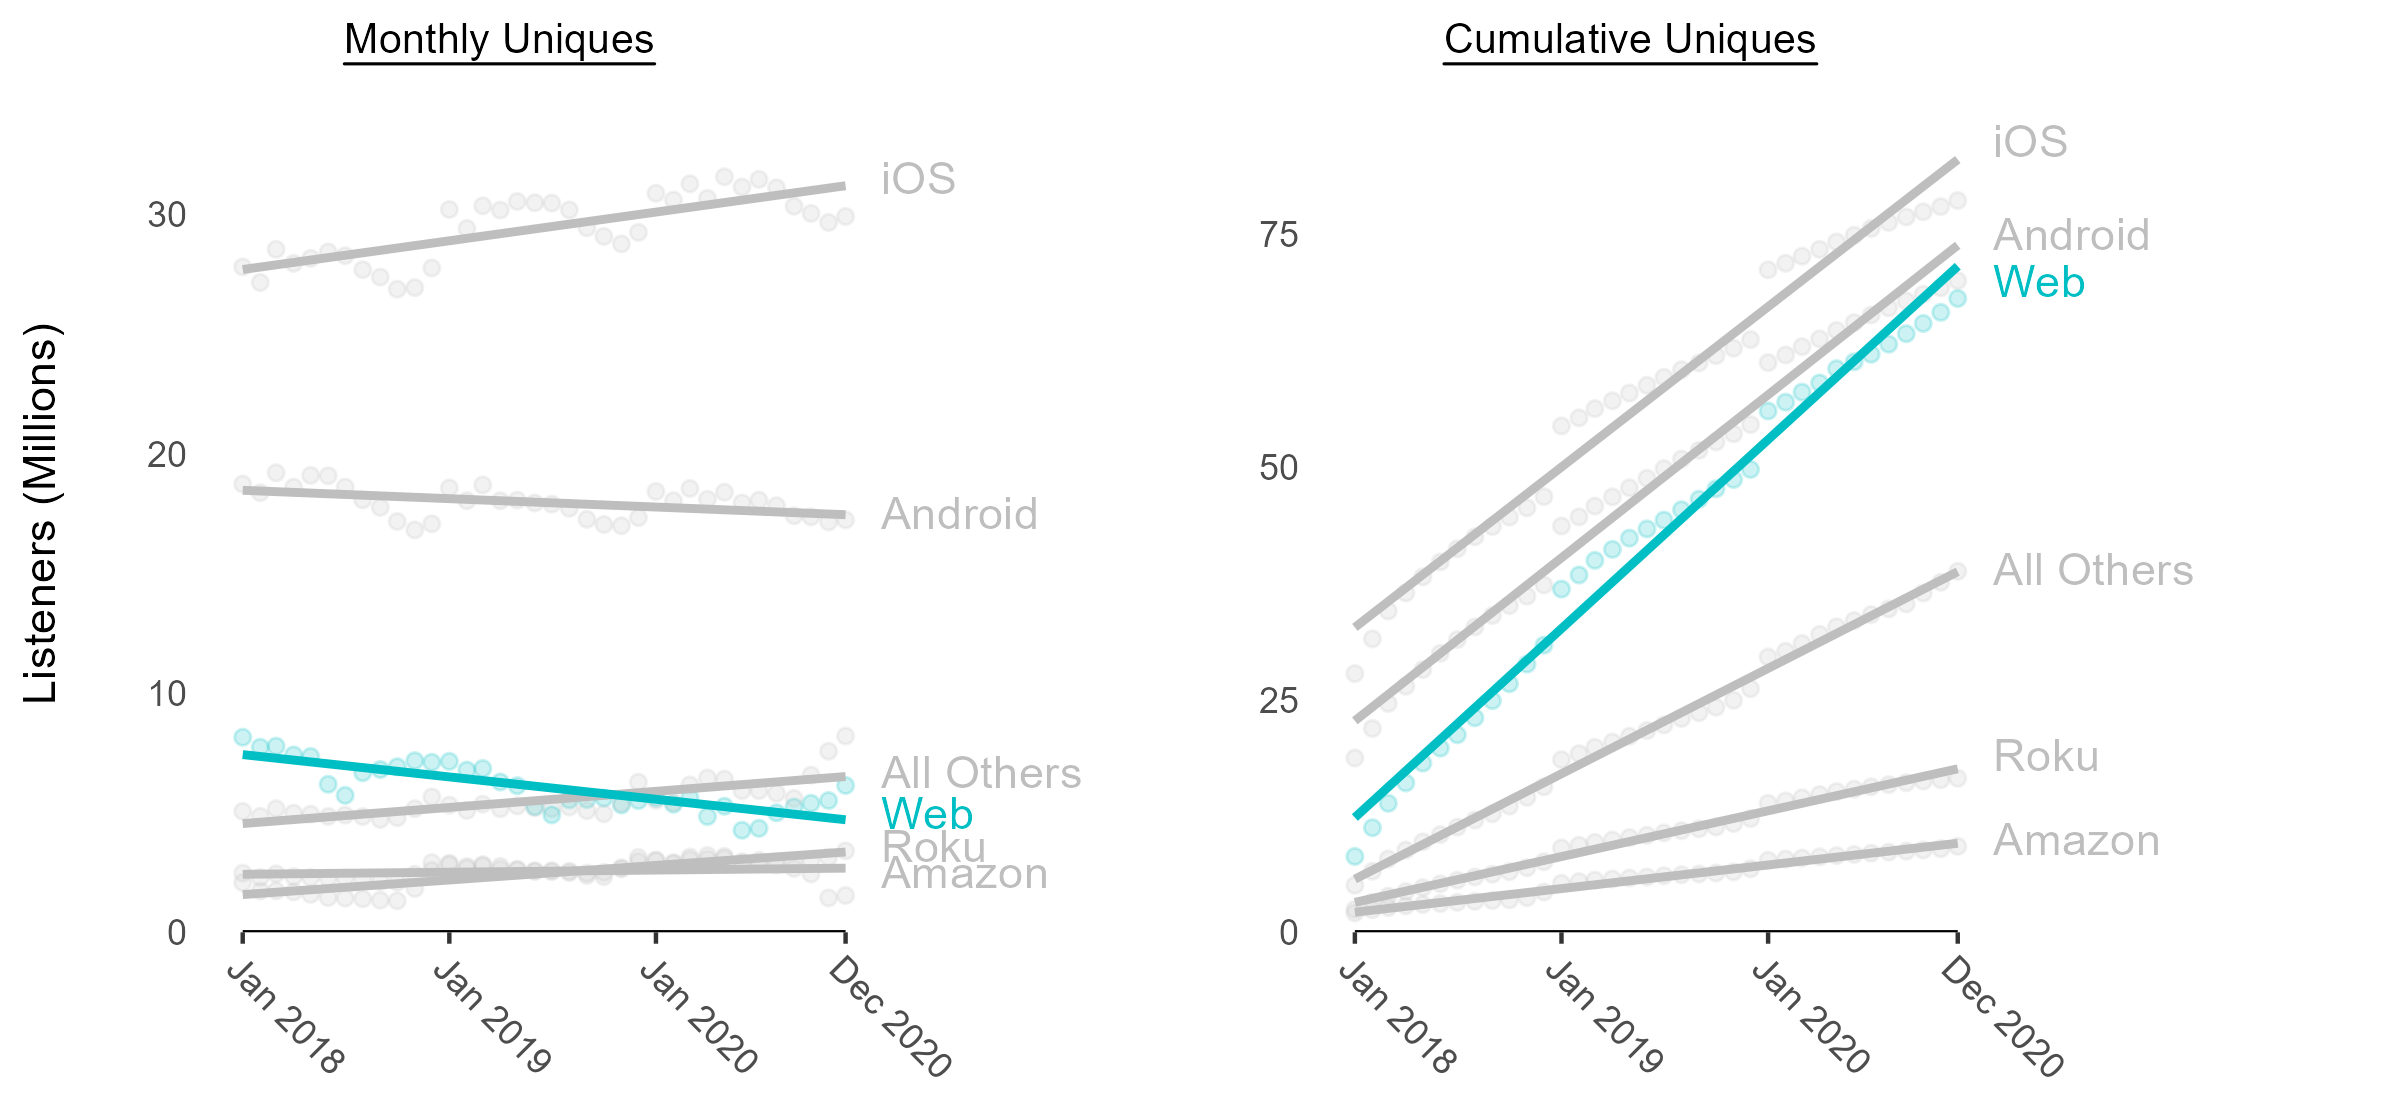
Monthly unique listeners by platform with trend lines: iOS rising from about 28 to 31 million, Android slipping from about 18.5 to 17.5 million, Web declining, All Others and Roku rising. Two panels: monthly unique listeners on the left, cumulative unique listeners on the right, with all platforms in color. Same two panels with iOS and Android highlighted: nearly parallel cumulative lines, but only iOS rises in monthly listeners. Same two panels with Web highlighted: the steepest cumulative line, but declining monthly listeners. ⤢ Enlarge
Some platforms gain listeners and others lose them

iOS, Roku and All Others gain monthly listeners over the period. Android and Web lose them.

First, rule out the easy explanation

Maybe the losing platforms just attract fewer new listeners. The right panel counts every listener each platform has ever had, so a steeper line means new listeners are joining faster.

Same new listeners, opposite results

iOS and Android gain new listeners at almost the same rate, but only iOS keeps them.

The two are used in similar situations on similar devices, so the gap points to something specific to Android, possibly in its interface.

Web: quickest to gain listeners and quickest to lose them

Web gains new listeners faster than any other platform and is on pace to pass Android in total reach, yet its monthly count falls the most.

Retention problems here don't come from acquisition, so the answer has to come from how people experience each platform.

The metric

Measuring choice, not presence

Counting listeners shows whether people show up. The usual alternative, average listening time, is harder to read: a four-hour session could be a devoted fan, or a speaker left playing at a party. So I used a standard measure of deliberate behavior, stickiness: the decision to come back.

Active days per listener = Sum of daily unique listeners across the monthUnique listeners that month

On how many different days does a typical listener choose to open the app each month?

Worked example · all platforms, Dec 2019 577,209,86664,435,575 = 8.96 days

This is the familiar DAU/MAU stickiness ratio, expressed in days: 8.96 of December's 31 days is a ratio of about 0.29. Days are easier to picture than a ratio, and they compare cleanly across platforms.

Why this metric

It captures purposeful behavior. Opening the app on a new day is a deliberate choice, and that makes it a reasonable stand-in for satisfaction and a likely predictor of retention.

Easy to use

It's easy to calculate, explain and compare. It needs only two counts that nearly every product tracks, and it means the same thing on every platform and in every month.

Finding 3

Stickiness shows two ways of listening

Listening frequency vs. listening time, by platform
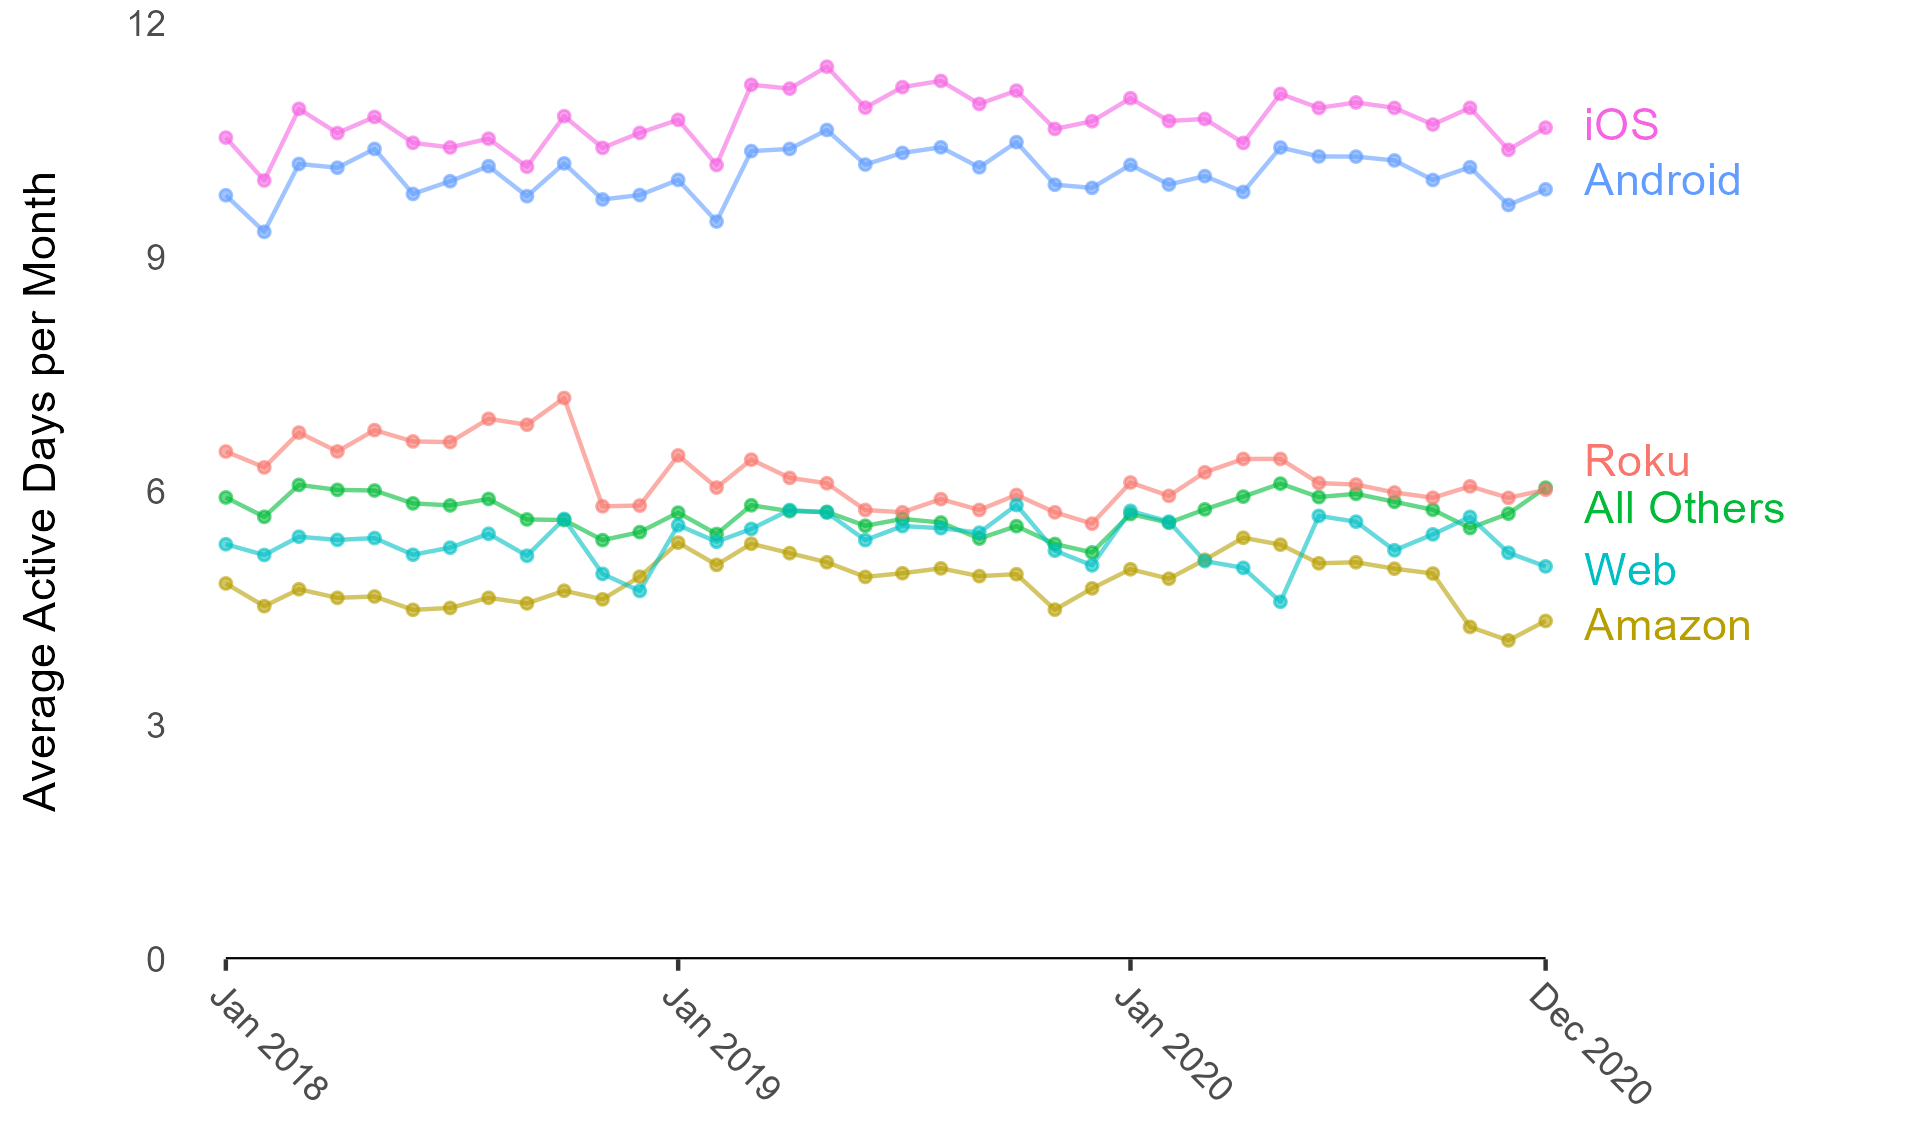
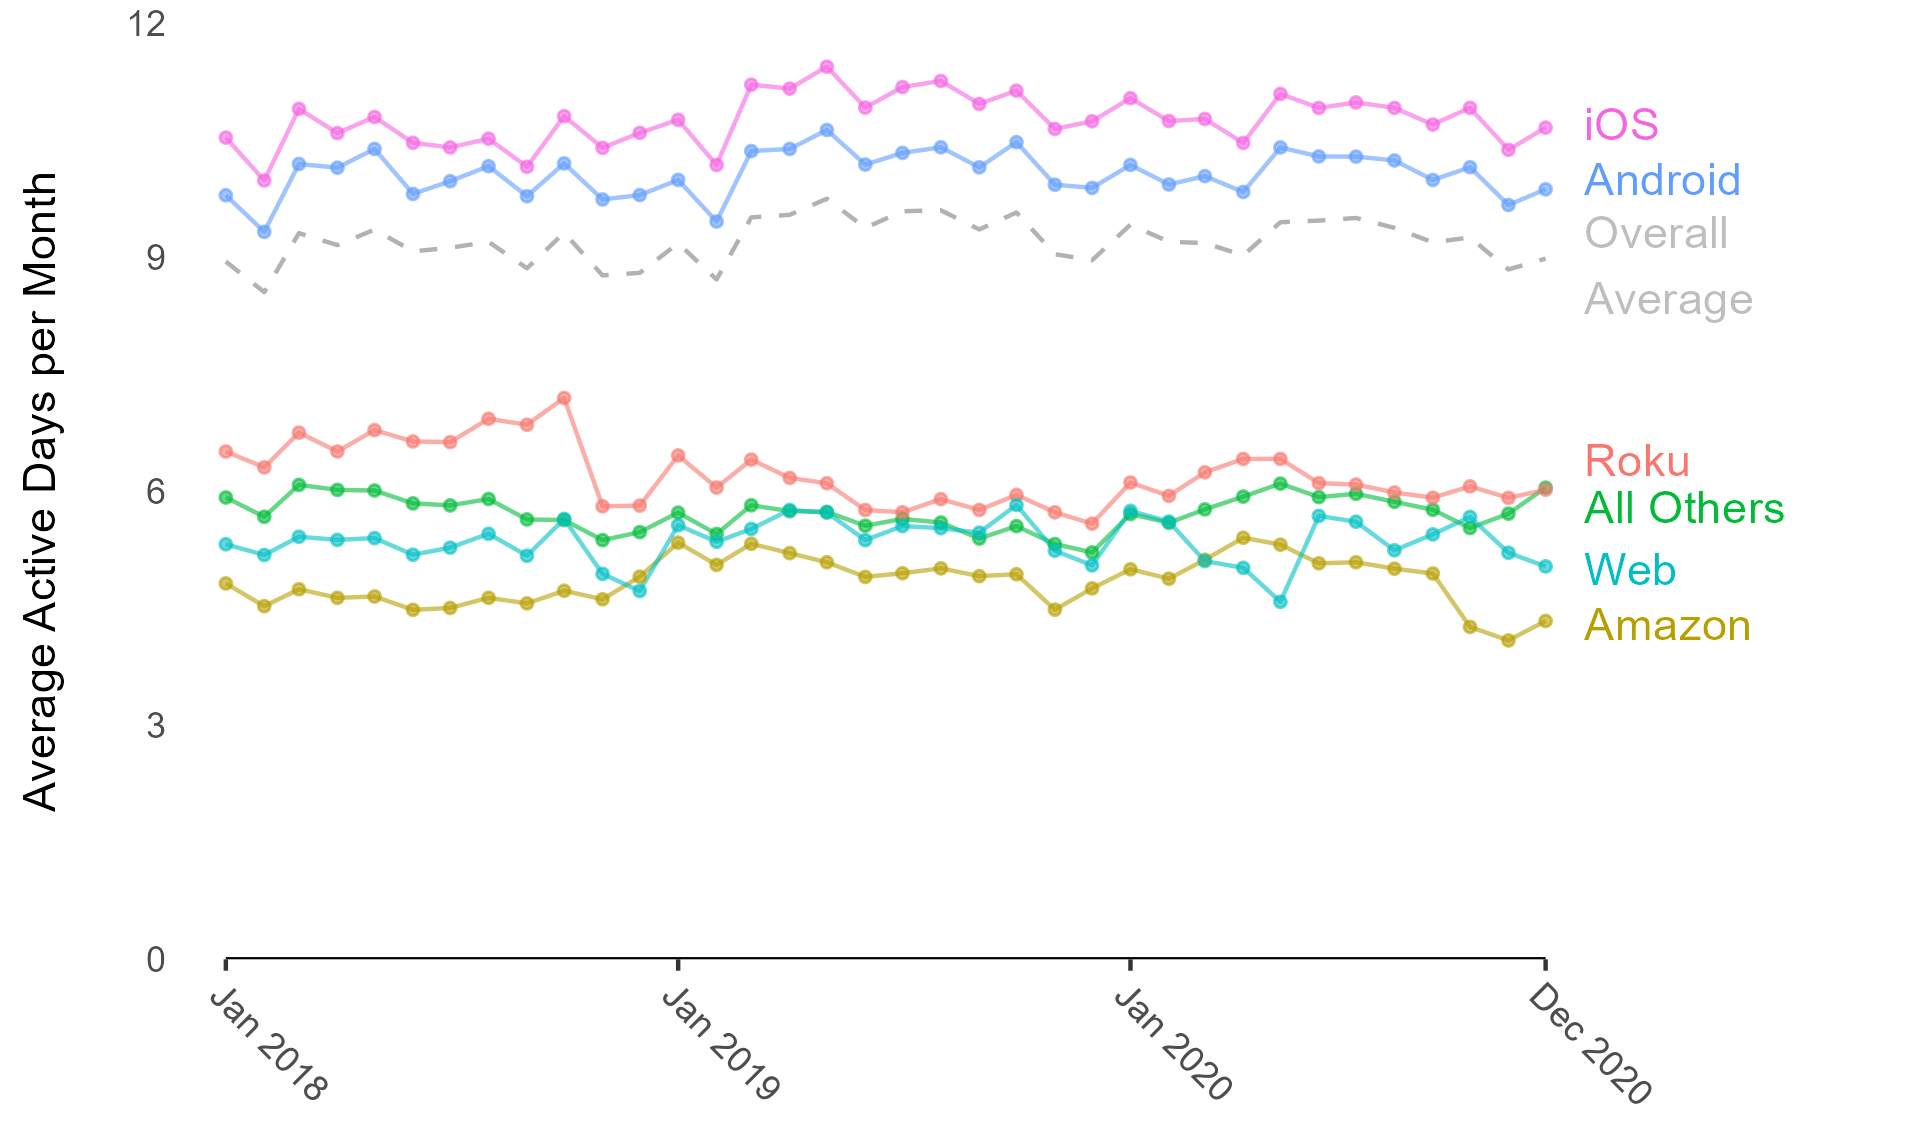
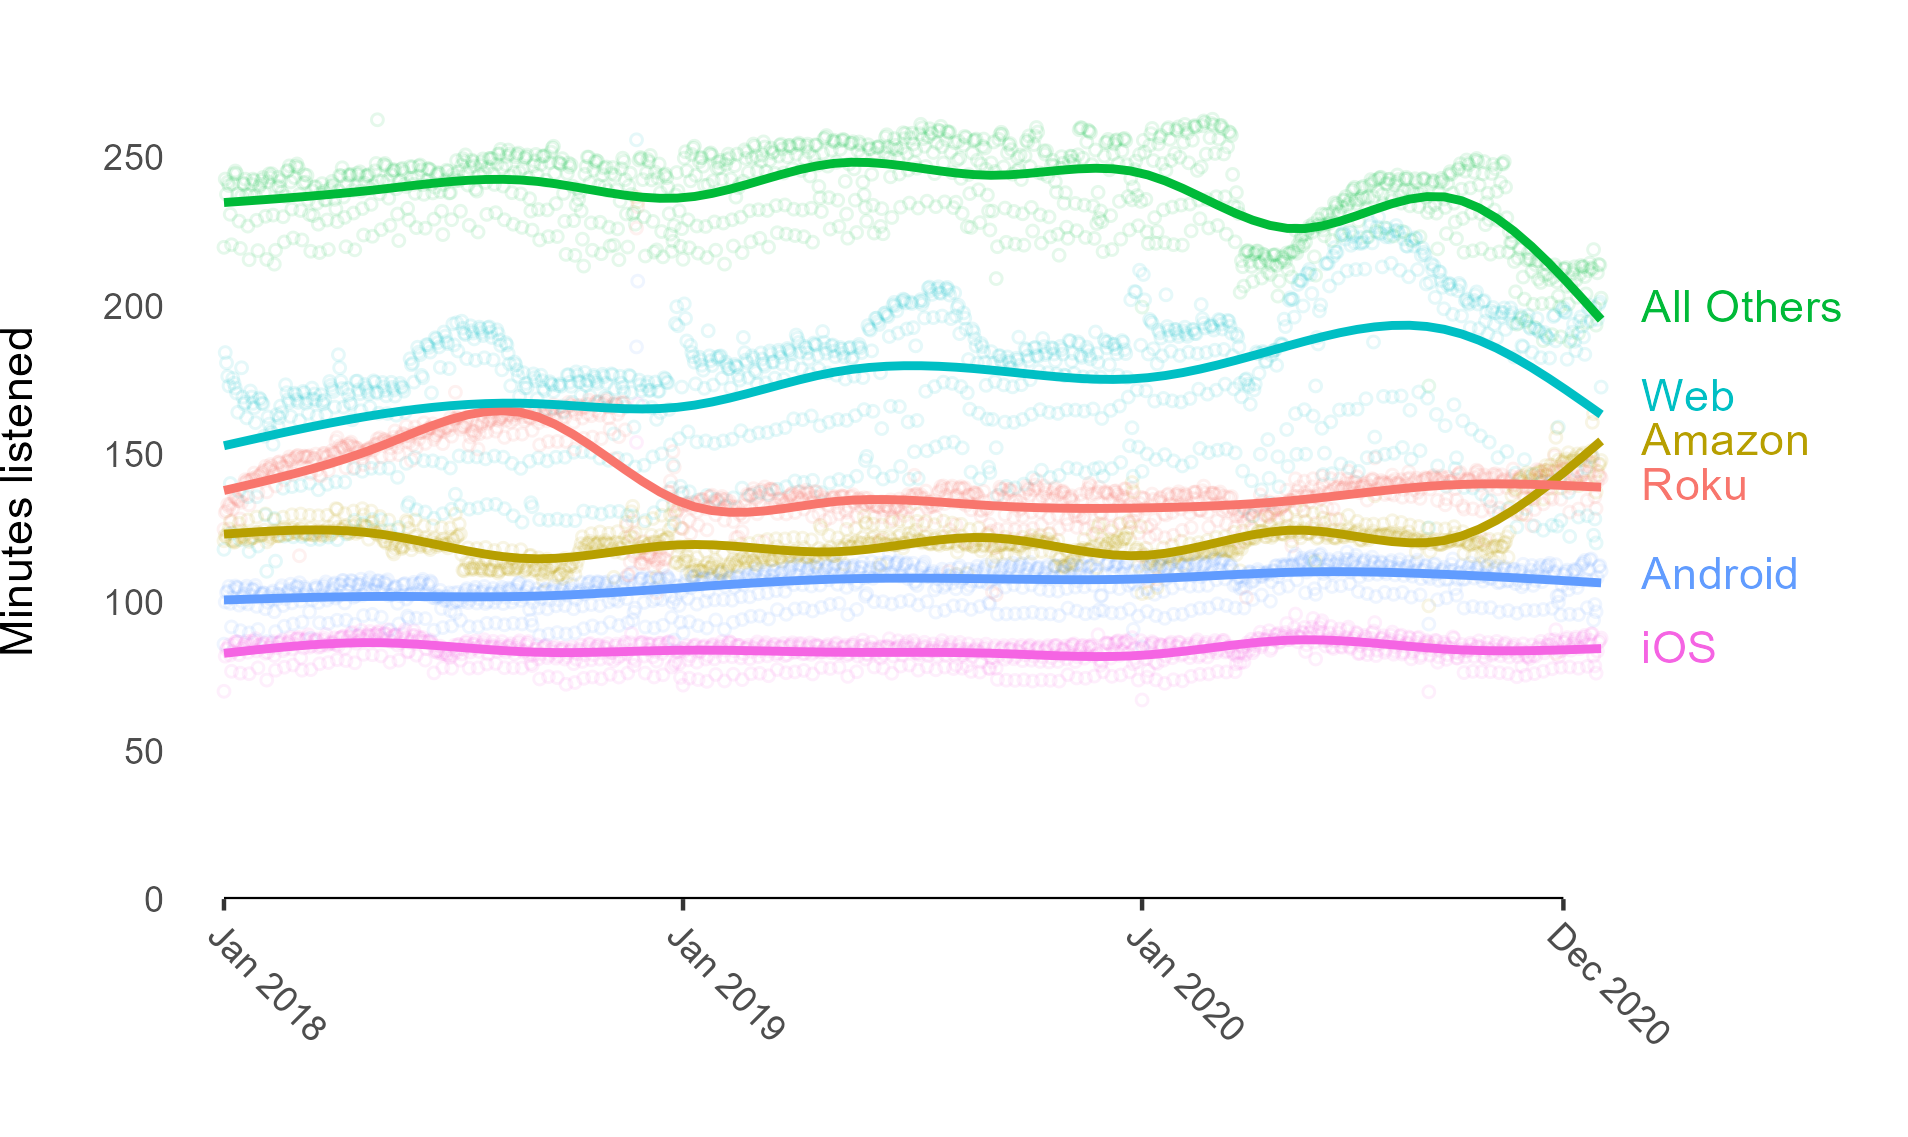
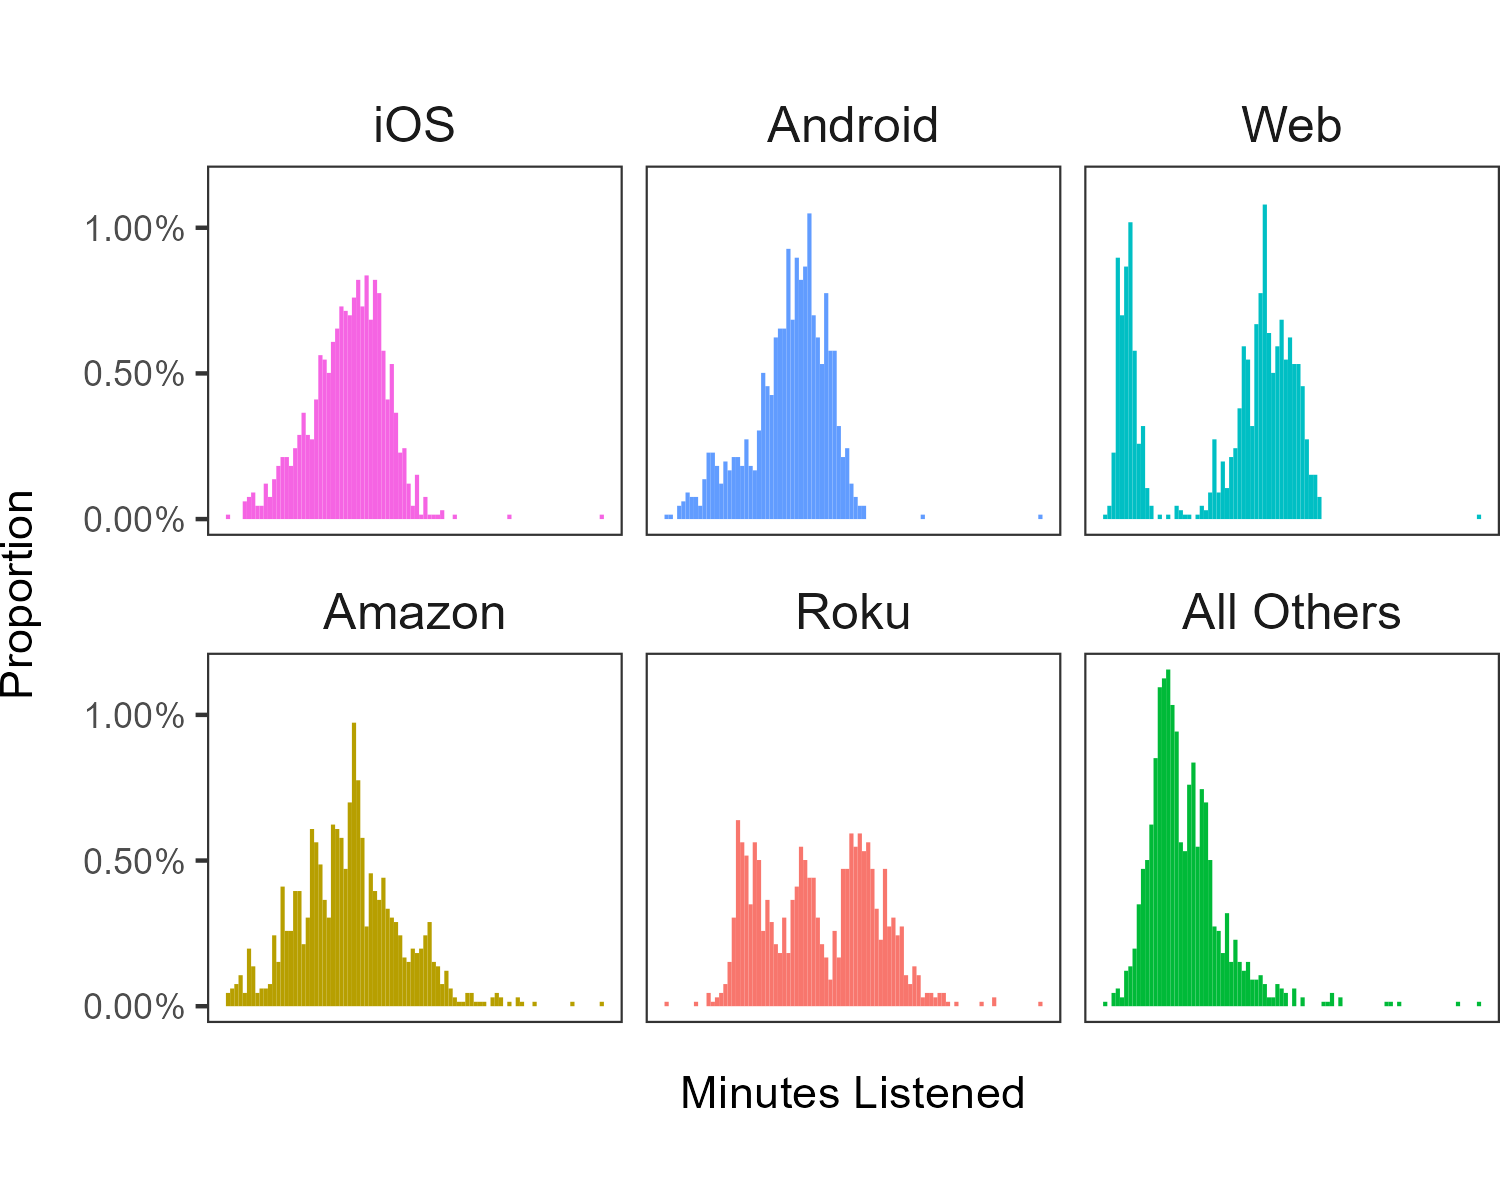
Average active days per month by platform, 2018 to 2020: iOS around 10 to 11 days, Android around 10, Roku, All Others and Web around 5 to 6, Amazon around 4.5 to 5. The same chart with a dashed grey line for the overall average, around 9 days per month. Average minutes listened per daily listener by platform: All Others highest near 240 minutes, Web around 175, Roku and Amazon around 120 to 150, Android around 105, iOS lowest around 85. Histograms of minutes listened for each platform: iOS, Android, Amazon and All Others each have one peak; Web has two (short and long sessions); Roku has three. ⤢ Enlarge

Mobile listeners come back the most often

Mobile listeners are active on about 10–11 days a month, compared with 5–6 on other platforms. In December 2019: iOS 10.74, Android 9.89, Roku 5.58, Amazon 4.75.

Mobile raises the overall average

Across all platforms, a typical listener was active on about 9 days a month. That average sits near the mobile lines because mobile makes up most of the audience.

Testing the metric's blind spot flips the ranking

Active days say nothing about how long people listen. By listening time, mobile goes from top to bottom: iOS averages 84 minutes a session and Android 106. Web averages 174, and All Others about 4 hours.

More active days, shorter sessions

Some platforms serve several uses at once

Session lengths on most platforms have a single peak. Web's split into short and long sessions, and Roku's into short, medium and long, which suggests several different reasons for listening on the same device.

What it means

Same product, two listening modes

How often people listen and how long they listen run in opposite directions. The platforms are being used for different things, so a single retention target for all of them would mislead.

Mobile · iOS & Android

Frequent and short

~10
active days / month
84–106
min / session
Illustrative month: one cell per day

Short sessions that fit into the day, many times a month.

Web, connected devices & others

Infrequent and long

~5
active days / month
~2–4 hr
per session
Illustrative month: one cell per day

Long sessions a few days a month, likely background listening at a desk, at home or at a gathering.

Also notable Year-over-year hours per listener, Dec 2019 → Dec 2020: Roku +17% and Amazon +10%. Every other platform was flat, which points to room for growth in living-room listening.
Recommendations

From findings to research questions

Behavioral data shows what is happening and where. Its most useful output is a short list of well-targeted why questions, and each recommendation comes with the study that would answer one.

FindingAndroid loses listeners that iOS keeps
Recommendation

Audit the Android experience for interface friction or performance problems.

Next study

A task-based usability comparison of iOS and Android on core flows, alongside crash and latency data.

FindingWeb gains listeners fastest and loses them fastest
Recommendation

Find out whether Web is a starting point people move on from or a platform that fails to hold them, and why it attracts so many new listeners.

Next study

Track listeners across platforms at the user level, plus a short on-site survey asking what brought them to Web and where else they listen.

FindingNew listeners arrive in January and drift away over the year
Recommendation

Give new listeners reasons to stay past the first months, such as push reminders or trial incentives.

Next study

Retention curves by the month listeners joined, and a survey of lapsed listeners about why they stopped.

FindingTwo listening modes: frequent and short vs. infrequent and long
Recommendation

Design and monetize for each mode. Find ways to add active days on long-session platforms (in-car listening, for example), and set ad timing by session length, with ads earlier in short mobile sessions.

Next study

A diary study of when and why people listen on each device, and an A/B test of ad frequency.